Standards Reports in Clear Learning Center
Standards Reports are available for 6-12 Texas educators.
-
Log into your MyCL account.
-
In your portal home page, select Clear Learning Center.
-
On the left toolbar, select the Reports button and then in the Reports Navigator select the Standards button.
-
You will see two reports, one for Interactive Assessments and one for Interactive Assignments.
Interactive Assessment Report
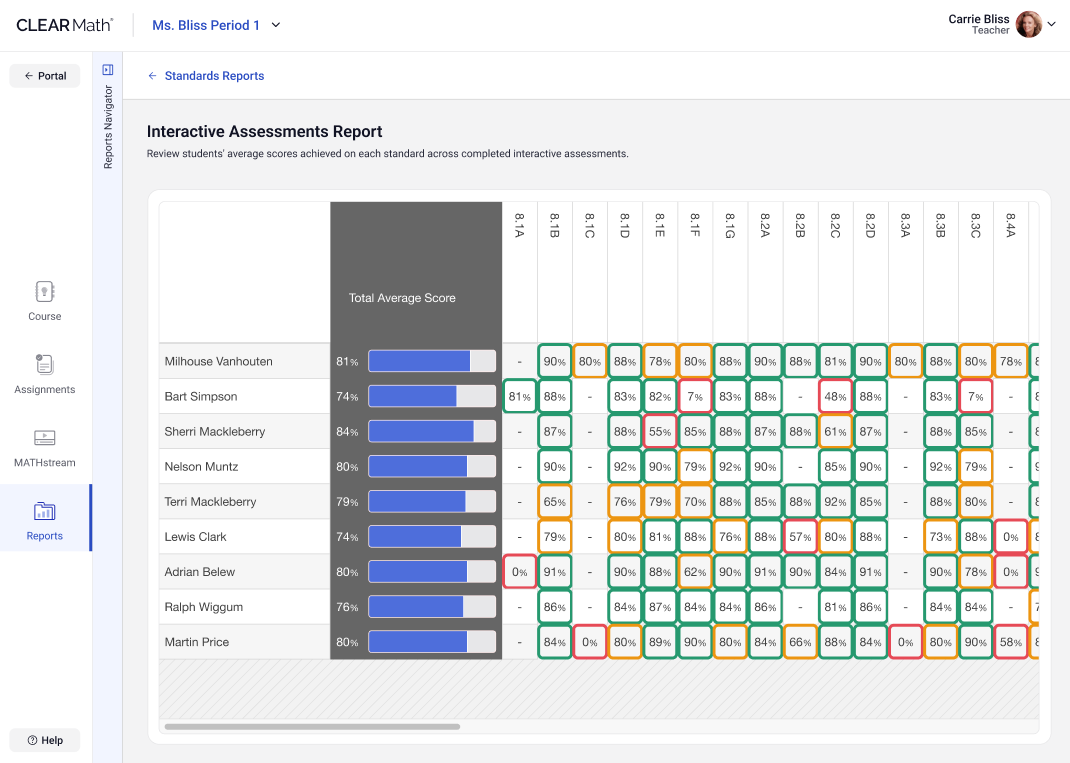
Use the Interactive Assessments Report to review students’ average scores achieved on each standard across completed interactive Assessments.
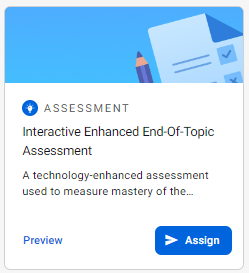
Assign Interactive Assessments (as shown below) to see the data reflected in this report:
As your students complete more interactive assessments, this report will provide you with a comprehensive overview of students progress on standards.
-
The left-most column shows the Total Average Score students achieved on all assessments they have completed.
-
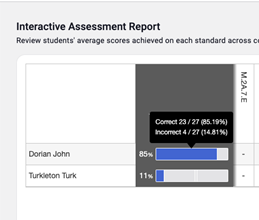
Hovering over the blue bar will show more information about how this percentage was calculated. You will see how many questions the student answered correctly, incorrectly, or did not attempt.
-
-
Each column to the right shows data for a specific standard
-
Cells highlighted in green indicate that a student has scored above 80% on that standard.
-
Cells highlighted in yellow indicate that a student has scored between 60% and 80% on that standard.
-
Cells highlighted in red indicate that a student has scored less than 60% on that standard.
-
Interactive Assignments Report
Assign Interactive Assignments (as shown below) to see the data reflected in this report:
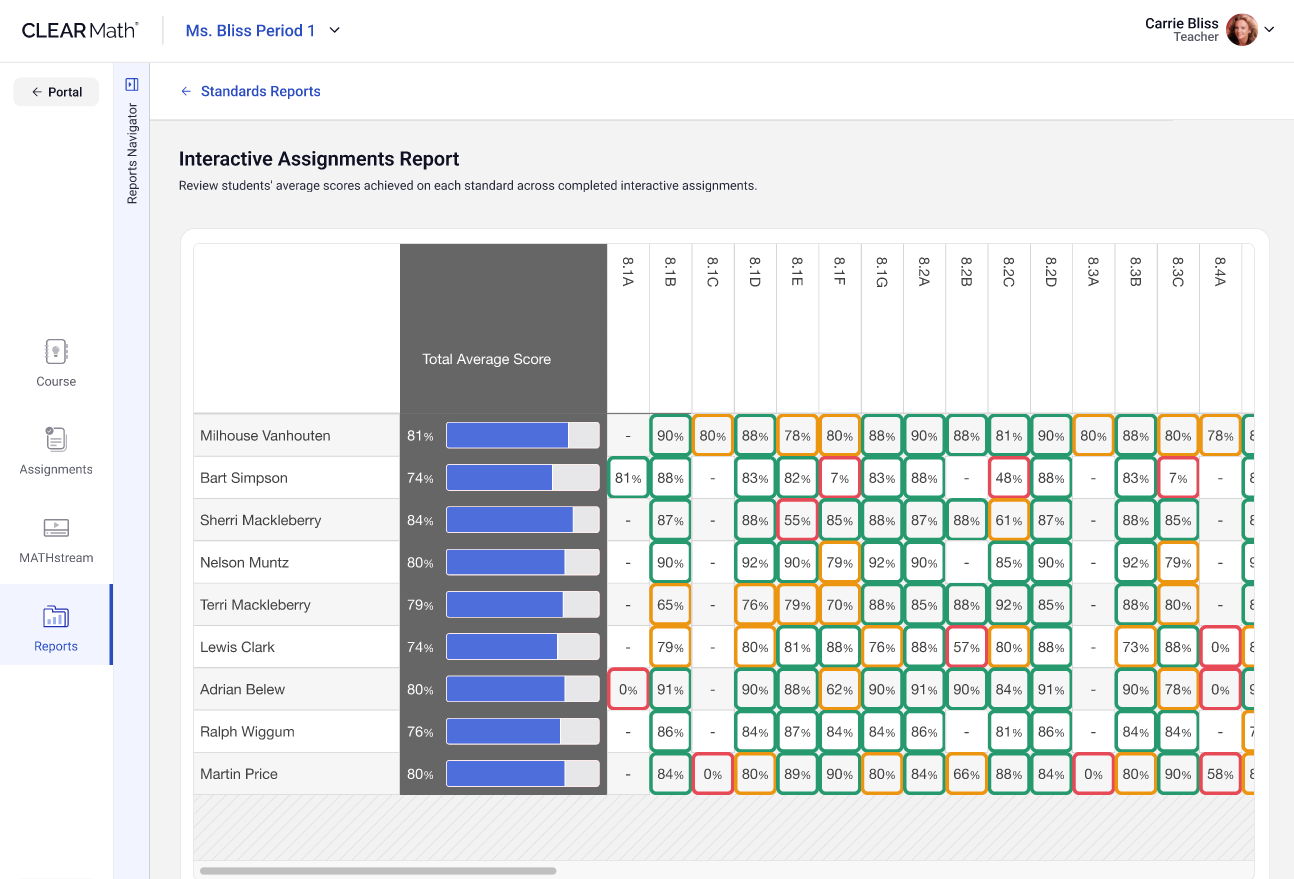
As your students complete more interactive assignments, this report will provide you with a comprehensive overview of students' progress on standards.
-
The left-most column shows the Total Average Score students achieved on all assessments they have completed.
-
Hovering over the blue bar will show more information about how this percentage was calculated. You will see how many questions the student answered correctly, incorrectly, or did not attempt.
-
-
Each column to the right shows data for a specific standard
-
Cells highlighted in green indicate that a student has scored above 80% on that standard.
-
Cells highlighted in yellow indicate that a student has scored between 60% and 80% on that standard.
-
Cells highlighted in red indicate that a student has scored less than 60% on that standard.
-

More Details
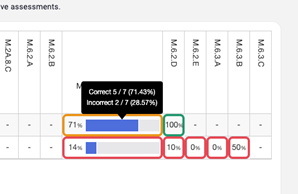
Each standard column can be expanded. Hover over any expanded column to see the number of correct and incorrect responses the student gave for that standard
View Assigning Content in Clear Learning Center to learn more about how to assign Interactive Assignments and Assessments.